"There are no facts, only interpretations." Friedrich Nietzsche | 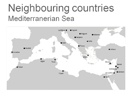 | 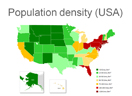 | 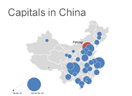 | 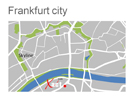 |
| |
Thematic maps
improve the understanding of data
Certain patterns in data are considereably easier to identify if depicted visually or spatially and interrelations can be seen more clearly. Thematic maps provide a standardised basis for illustration and show key aspects, distributions or weighting.
We create thematic economic maps for you which resolve the complexity of spatially interacting factors and provide a comprehensible illustration. Relations become obvious and are easily explained when looking at a map.
We also provide statistical maps showing spatial units by way of diagrams or coloured surfaces. Several levels of information can be included into one map such as population density, infrastructure and rental prices for example.
All of that of couse in line with the rest of your presentation and your corporate design.
Send us your data we are happy to advise you which details can be combined to form an informative map .